One of the most important aspects of Sports Investing is indeed Money Management. Like with anything in life, be it with your salary & investments, if you don’t manage your money properly and do not efficiently budget then you do not know how much is coming in and how much is going out, and this can only lead to failure. This concept applies exactly with Sports Investing, you could have the best system that wins 80% (which is theoretically impossible with manual handicapping systems) but you could be in big losses. Why? Because you did not properly manage your capital aka ‘bankroll’.
There are many methods of managing your bankroll and the most popular ones are fixed wagers, martingale (doubling down when you lose) and 2x-3x successions. Martingale is a very aggressive strategy and I personally believe that although it could profit slightly but you will need a strong win ratio and the Drawdowns (the peak-to-trough decline) will be immense. Therefore, I will not focus on it as it can be very dangerous.
This article instead will go through fixed wagers as it is probably the safest waging style around because your losses and gains are capped and are not “floating” thus creating less drawdown. In fixed, there are 2 types: you can either fix your risk level (say 1% of your bankroll) so you know your MAXIMUM loss or you can fix your reward so you always know much you will win (say 1% of your bankroll too).
Both methods have their merits and disadvantages but after an extensive analysis, I find that risking 1% is much more profitable and has much less drawdowns and is less dependent on odds. Although 1% reward allows steady gains, when betting on favourites for example you may lay down a large amount of capital to earn 1% which clearly isn’t an efficient use of capital. Nevertheless, I will let the data speak for itself.
Risking 1% of Bankroll (fixed 1%)
With a 1% risk of bankroll, the sports investor will always know the maximal loss on a game which is great loss preventing measure and is not determined by a variable such as an odd. The reward is also uncapped as it is only limited by the odd.
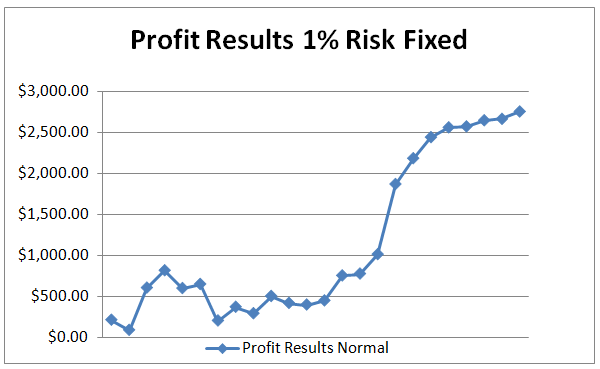
Let’s pull up some graphs and see how it performs (broad 50 game performance):
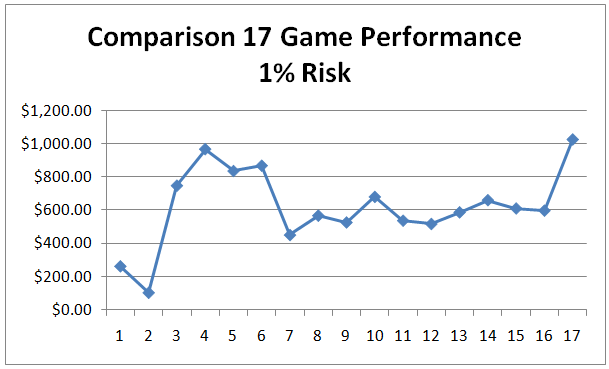
To compare with the alternative 1% Reward, a closer 17 game performance:
These charts show that 1% risk that the reward is uncapped and due to the uncapped rewards, profits are allowed to fully run whilst losses are capped. However, it also shows that due to the fixed 1%, the losses can in no way be minimized unless a system of points/betting units is used (wager sizes is dependent on the hot trend and stars of a game (i.e. -1 dogs will get a lower betting unit than a ML favourite). However, for simplicity I used a 1% throughout to ensure that no complications arise.
For greater in-depth view, let’s also look at the statistics of this dataset.
| Average Wager Size: |
$52.94 |
||
| Average Loss: |
-$52.94 |
||
| Average Win: |
$59.35 |
||
| Largest Win: |
$105.88 |
||
| Largest Loss: |
-52.94 |
||
| Average Value of a Consecutive Loss |
52.94 |
||
| Standard Dev of Bet Size: |
0 |
||
| Standard Dev of Earnings: |
53.29077612 |
||
| Maximum Bankroll Risked In a Day Total % |
26% |
||
This shows that your Average loss will always be 1% of your bankroll (-$52.94 in my case) but your Average Win and Largest win will indeed be variable. This is also indicated by the standard deviation which highlights variable earnings.
1% ROI Bankroll Reward
The 1% Reward on your bankroll is also great too, it allows you to fix your gain so no matter how poor the line you will still get your 1% return on investment for each game you win. This allows you to ensure that your reward is fixed and allows you to build real momentum if you have a good win record. However, the problem of the 1% reward is that your risk is variable so you don’t know your risk until you actually see how the line is — and depending on that your risk is calculated. Many people do not have the bankroll to stomach large caps to earn a predetermined amount (for example, laying $600 to win $200 only). This results in great drawdowns when going through a though period of time as you’re laying quite big amounts to win little.
However aside from the subjectivism, let’s put it to the test.
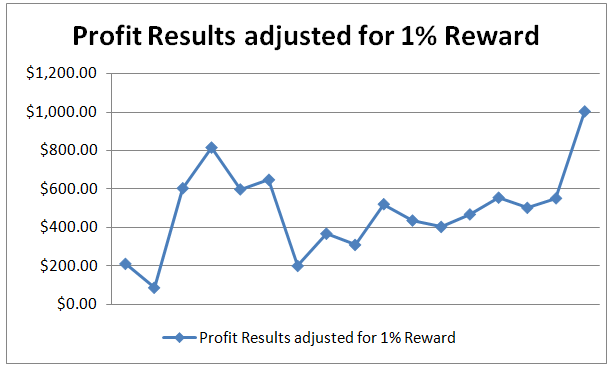
(Due to the unavailability of odd/line data for the rest of the 50 games (odds weren’t logged), this chart is the only one available).
This chart also shows that due to the fixed reward and a high ratio of winning games, the 1% still reaches a level very close to the 1% risk level but faces through a lot more turbulence than the 1% risk due to bad days within the testing period. Thus, we can deduce that this method is indeed a good method of money management, but is not optimal for a typical investor who likes to be risk-averse (why go through unnecessary turbulence to get the same level?). However, to fully confirm our theory this method requires a large risk tolerance, let’s check back to the stats:
| Average Wager Size: |
$56.46 |
|||
| Average Loss: |
-$49.32 |
|||
| Average Win: |
$52.94 |
|||
| Largest Win: |
$52.94 |
|||
| Largest Loss: |
-$139.32 |
|||
| Average Value of a Consecutive Loss |
-$58.40 |
|||
| Standard Dev of Bet Size: |
$60.80 |
|||
| Standard Dev of Earnings (Inc Losses): |
54.00917 |
|||
| Standard Dev of Earnings (Exc Losses): |
0 |
|||
| Maximum Bankroll risked In a Day | ||||
| Total % |
22% |
|||
The statistics paint a picture that the average wager size is larger than the 1% risk but surprisingly the average loss is lower than the 1% risk. This is one great advantage of this method as the losses have the possibility of being lower. However, the range varies from $139.32 to sometimes $20 due higher odds. This is also reflected within the standard deviation of bet size which is a measure that shows that it varies +$60.80 from the mean ($56.46). This also answers the question of why the average loss is lower than the 1% risk method yet creates a graph with larger drawdowns due to the standard deviation of the wager size.
Also interestingly the maximum bankroll risked in a day is lower than the alternate method, as during the testing I have selected games with good lines and avoided games which add little value (unless they are in a large hot trend such as a 4-5* home favourite).
Conclusions
To conclude, both methods seem to reach the similar profit targets and similar wager sizes provided that games that have very low odds (games lower than 1.5 are not recommended) so it’s matter about the risk tolerance of the investor. If you are someone that stomach larger losses and higher drawdowns, then the 1% reward may work for you. Personally, I’d still choose the 1% risk method as I use a wager point system which allows me to leverage games that are in a hot trend and bet less for games that aren’t. Whilst with 1% reward it is hard to adjust as you are dealing with the reward rather than the amount at risk. That’s not to say that the 1% fixed reward method isn’t bad, but is matter of my risk tolerance. So in the end the choice is up to you…
Disclaimer Note: This is based on the most simplistic cases and due to time constraint I was unable to combine these graphs to see a mixed picture as it would require optimization to see what mix would be best. Also this a smaller sample size and over a larger period results may differ.
About the author:

P.S. Upgrade to Zcode VIP Club and Unlock All Winning Picks. Instant Access.


