I understand that I will be using Trends & Signals with simulated odds which may lead to incorrect odds and incorrect results. Such trends are developed for experimental and research purposes only and should not be used for real money betting.
System type
Profit Time
Sort method
Check AllorUncheck Alltrends withthan
Bankroll Calculation
Set initial value for
or
Display Twitter Feed
Select sports
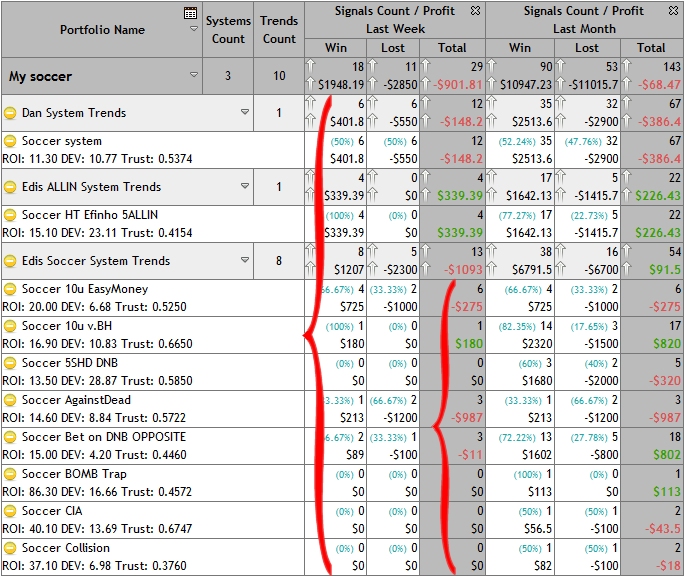
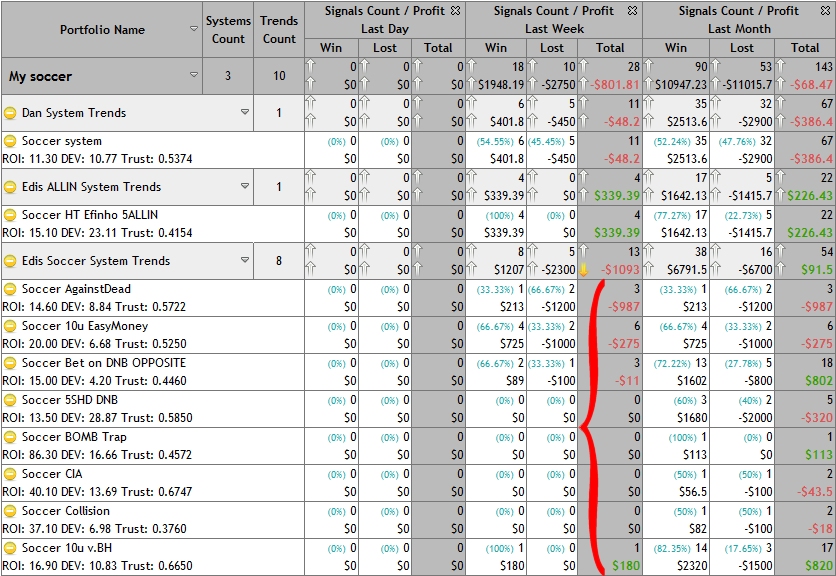
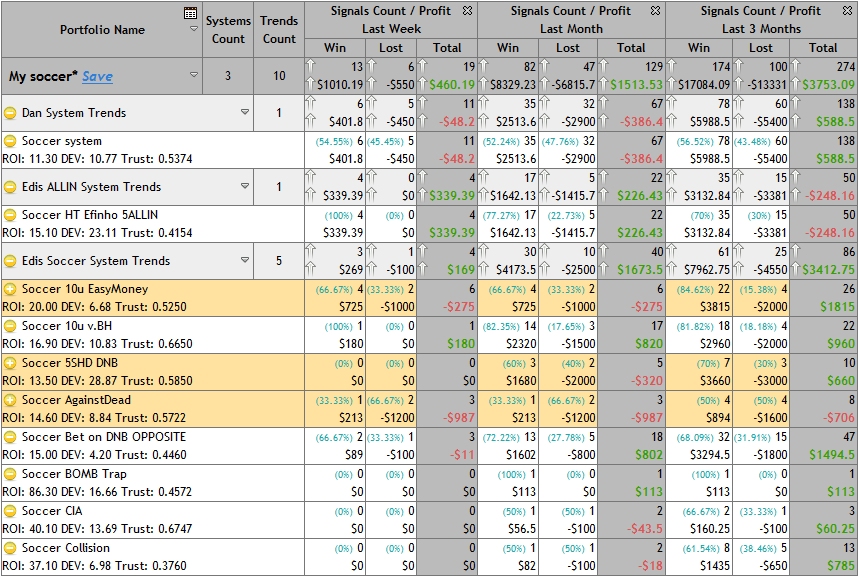
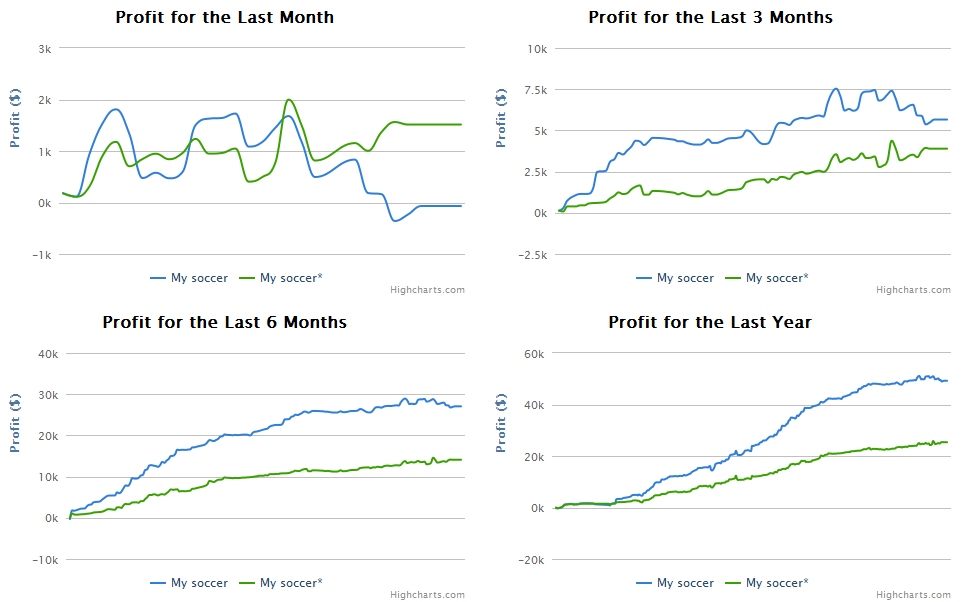
All Systems Profit Chart
3 years1 year3 months
Portfolio Profit Chart
3 years1 year3 monthsCustom
FromTo
Ok
Today's Signals For the Selected Portfolio of Systems Auto Updated Every 5 minutes
Past Signals For Your Trends
My Bet History
Signals
Sort by
Set My Unit Size
OkCancel
+−
What is Portfolio Analyzer and How To Use It?
The idea is to determine which trends make the portfolio profitable, and which ones - unprofitable.
For each trend, the total number of signals is calculated, among them - winning and losing ones, the corresponding profit in the context of the following periods: Last Day, Last Week, Last Month, Last 3 Months, Last 6 Months and Last Year. Then the same indicators are calculated for the systems.
Look at the image where the red braces are located.
Trends are painted in white background color, systems in light gray and portfolios in gray one. Look at system Edis Soccer System Trends. The top number in the cell is the number of signals, the lower number is the profit. Let's calculate summary of signals count and profit by trends inside this system:
You will see these numbers in the corresponding cell of the system.
In the same way if we calculate all portfolio trends, we get the values of the number of signals and the profit for the whole portfolio.
The user is given a flexible option to view the statistical data of the portfolio: using icons with arrows, you can sort the trends by quantity or by profit, descending and ascending. You can also sort systems within one portfolio. In the following picture the column with the red brace is sorted by profit ascending order.
You can skip any trend or system from the calculation by clicking the small icon with minus sign located close by the trend name. This will change its background color. Statistics will be recalculated automatically. To return the trend back to the calculation is possible by clicking the plus button. In the following picture trends Soccer 10u EasyMoney, Soccer 5SHD DNB and Soccer AgainstDead are skipped and their data don't take part in the calculation.
The line of the alternative profit will be shown on the portfolio chart without taking the skipped trend into account.
If the user is satisfied with the result, then it is possible to save the resulting portfolio. There is the link "Save" close by the portfolio name.
In the lower part of the window there are comparative graphs of all user portfolios in the context of different time periods.
Thus, by analyzing the statistics, and skipping and including the trends to the calculation, the user can select the optimal set of trends for his needs, and then save it in the portfolio.
Please wait while the server collects statistical information. This may take some time.
Portfolio Name:
The following trends will be saved in the Browser Push Notifications Settings.
AppendOverwriteCancel
LiveBet Room
Live Betting Room is only active during the live betting sessions.
Follow Zcode Wall to see when the next sessions will start.
Expert Journal
To get started please select the experts you want to follow and get
notifications. Click here.
zLive Bot Signals
Stay tuned, the zLive bot is monitoring the
active games to find the profitable winning
bets. Once found, the bets appear hear
automatically, no need to refresh.
👍 BOOM! Cashed! The bet won!
✅✅✅ De Graafschap - Helmond Regular time Total Over 2.5
🤑 Payout 141 USD
👍 BOOM! Cashed! The bet won!
✅✅✅ Volendam - Dordrecht Regular time Total Over 2.5
🤑 Payout 147 USD
👍 BOOM! Cashed! The bet won!
✅✅✅ FC Emmen - Telstar Regular time Total Over 2.5
🤑 Payout 141 USD
👍 BOOM! Cashed! The bet won!
✅✅✅ Akli A. - Giovannini L. Regular time 1x2. Bet on Akli A.
🤑 Payout 141 USD
👍 BOOM! Cashed! The bet won!
✅✅✅ Catanzaro - Sassuolo Regular time Total Over 0.5
🤑 Payout 135 USD
Live bet 🔥 at 04:09 pm et
🏀 Basketball. France Pro B
🏆 Evreux - Hyeres-Toulon
✅ 4th Quarter Handicap -5.5 Hyeres-Toulon
👁 Current Score: 80-67
📈 Odd: 1.548. Bet 100 usd
🤑 Payout 155 usd
Trust factor is a new parameter that helps you to compare how the "forward" test results match the backtest results. The closer they are to backtest the more we can trust such system.
Why there can be the differences between backtest and forwardtest?
Because the backtest is usually done on the closing odds while the forwardtest signals are usually locked with odds 3-4 hours before the game starts. In many cases it does not matter but for some systems such difference result in worse forward test than backtest. Trust factor will help us identify the systems we can trust more with the forward live test. The trust factor has nothing to do with how profitable the system is in terms of $.
ROI (Return on investment) is a parameter that helps you to measure efficiency of an investment or a series of investments.
ROI is the relation of the investment's profit to the cost of investment.
Larger ROI is better.
Avg Dev (Average Square Deviation) is a statistical criterion, which shows how the real profit values differ from the expected.
The higher the value, the more jumps and irregularities in the graph of profit.
Smaller Avg Dev is better.
Best Total Profit - total profit for all the time of existence of the trend.
Best Profit (3 months) - profit for the last 3 months. Larger Profit is better.